EMA co-registered EMA and Ultrasound dataset.
(Open access – no commercial licence for AAA required to analyse this dataset)
This co-registered EMA and ultrasound dataset is distributed under the NON COMMERCIAL LICENCE Attribution-NonCommercial 4.0 Generic (CC BY-NC 4.0).
Acknowledgement.
Access to EMA and expertise of A. Turk and C. Macmartin funded by the European Research Council (ERC) under the European Union’s Horizon 2020 research and innovation programme (PlanArt: Planning the Articulation of Spoken Utterances; ERC Advanced Grant awarded to A. Turk; Grant agreement No. 101019847) awarded to A. Turk, University of Edinburgh.
The dataset consisted of 200 phonetically balanced sentences (SCRIBE set A [1]) recorded by a male Scottish English speaker 50-60yrs. All data streams synchronously recorded using Articulate Assistant Advanced (AAA). Instrumentation included 22kHz audio, Carstens AG501 EMA, 4 tongue sensors, upper/lower lip, jaw sensors. Ultrasound was recorded with MicrUs midsagittal B-mode Ultrasound using MC4-2R20S-3 transducer set to 2MHz, 90mm depth and 100% Field of view providing 81 frames per second. The transducer is head-stabilised using an UltraFit with nylon nuts and bolts to avoid interference with EMA. A front-facing lip video is also recorded using NTSC analogue camera mounted on UltraFit. Image stream is de-interlaced to provide 60Hz 320×480 pixel resolution.
Great care was taken in configuring the ultrasound field of view to include the whole of the tongue, mandible and hyoid. Depth, frequency, dynamic range, power, contrast, probe alignment, amount of gel and firmness of probe contact were optimised for image quality. If the images are indistinct or incomplete, then the results will be adversely affected.
The variance of the estimated keypoints is limited by the resolution of the image data provided to DeepLabCut [2]. In a trade-off with speed of estimation, the 812×1000 pixel ultrasound images are exported to DeepLabCut as 320×240 pixel images which, for this dataset, corresponds to a pixel resolution of 0.44mm/pixel. We use 2MHz ultrasound pulses to provide best penetration and contour brightness, which, due to ultrasound physics corresponds to a radial resolution of 1mm. To obtain 81Hz sample rate, we use 64 scanlines to image a 101.2degree field of view. So, at the tongue surface (approximately 70mm) the angular resolution is 2mm.
Co-registration was carried out in the following steps:
Step 1. Run a speaker independent (SI) DeepLabCut model that is trained on hand-labelled data from lots of systems and speakers [3] to get an estimate of the keypoint positions.
Step 2. Measure the spacing in mm between the keypoints. Step 3. Use AAA to record synchronous EMA and ultrasound, placing the sensors at the spacing of step 2.
Step 4. In AAA, create Analysis Values corresponding to the x and y positions of the keypoints and EMA sensors and x/y plot them in AAA (see figure 1).
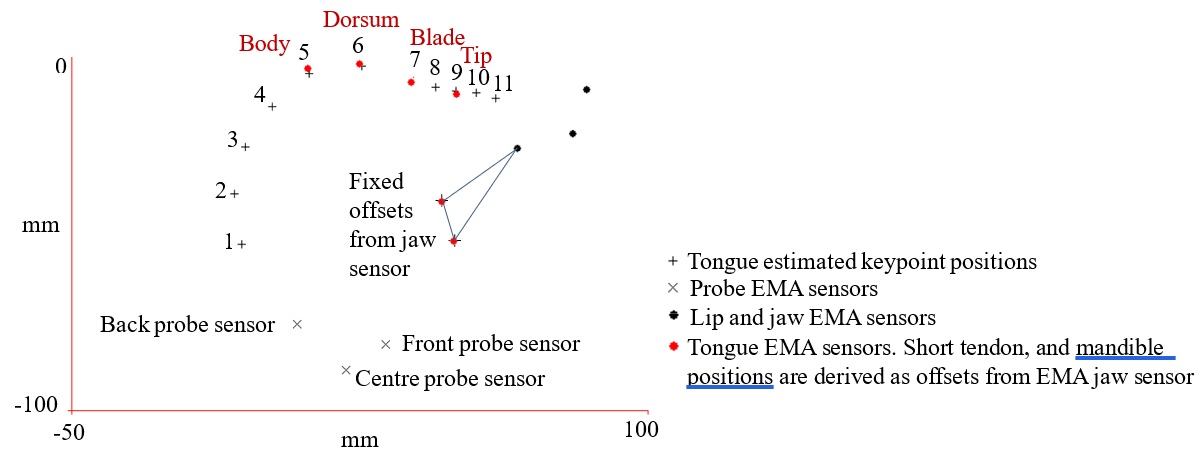
Figure 1: EMA sensor positions and keypoints (from SI hand labelled model) for a single frame after aligning Euclidean spaces using fiducial. Short tendon and mandible keypoints assigned as fixed offsets from the EMA jaw sensor.
Step 5. Create a fiducial and interactively move it to shift the keypoints in the AAA x/y plot so they match the four corresponding EMA sensor positions (see figure 2).

Figure 2: The fiducial is manually positioned and indicates the origin and orientation of the EMA Euclidean space
Step 6. To correct for probe movement, pick a point in time with minimum jaw opening and record the position of the probe centre EMA sensor. Then subtract any difference in this sensor position frame by frame from the keypoint co-ordinates. Correction for within plane rotation was not performed (see results).
Step 7. Check that the keypoints and EMA sensor still match and adjust the fiducial if necessary.
Step 8. Calculate the reverse mapping of EMA sensors into ultrasound image pixel co-ordinates and create DeepLabCut label files from these mapped EMA sensor positions.
Step 9. Hand label remaining training keypoints by extrapolating from the EMA data.
Step 10. Train the speaker/session dependent DeepLabCut model based on 560 frames (50ms apart from 6 sentences).
Comparison between the positions of the four EMA tongue sensors and the corresponding keypoints generated by the EMA trained DeepLabCut model (Step 10 above) was carried out on 1059 frames from 10 holdout sentences by the same speaker and session. Keypoint displacements were smoothed in a post-processing operation using a Savitzky-Golay filter (m=4, 120ms window). See UltraFest conference proceedings paper ‘Improving ultrasound pose estimation accuracy by training on co-registered EMA data.’ [4] for more details on EMA ultrasound correlation and accuracy of t DLC estimation.
The project can be loaded and analysed WITHOUT the requirement to pay for an AAA licence. Download the latest version of AAA from the downloads menu on this website. After installing AAA, go to the main menu option File | Open project to load the project. then select the Analyse ultrasonic tab at the top of the application. New data cannot be recorded or imported into these projects. They have been synchronised and tongue contours have been estimated using the EMA_MobileNetV2_100 model trained on EMA sensor positions from this speaker’s dataset.
Co-registered EMA and Ultrasound dataset (28GB, 21GB zipped, Download time 2 hours) 200 sentences by single speaker.
Co-registered EMA and Ultrasound Sample dataset (1.3GB, 0.95GB zipped, Download time 6 minutes) First 10 sentences of dataset.
How the data looks in AAA
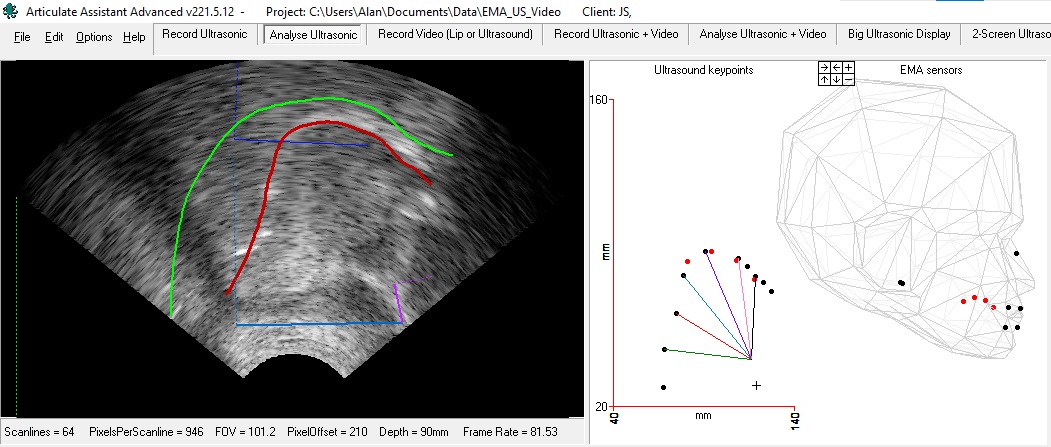
Figure 3. ON LEFT Ultrasound with red tongue contour estimated by DeepLabCut model trained on EMA sensor postitions. Green palate trace extending to pharynx indicating upper boundary of vocal tract. Blue line from hyoid to mandible base. Purple line from short tendon (superior mental spine on mandible) to mandible base. ON RIGHT Black dots indicate position of keypoints that make up estimated tongue contour. Cross indicates mandible base. Red dots indicate position of four EMA sensors. Head shows position of the same red EMA sensor positions and sensors on the upper and lower lips, upper incisor, lower incisor (jaw) with bridge of nose and twin ear sensors defining head position. In the keypoint x/y plot the five black dots connected to the short tendon by lines coloured green, red, blue, purple, and pink have been extrapolated form seven estimated keypoints and represent the doming and grooving of the five neuromuscular compartments defined in the research study “The compartmental tongue”[5]. This colour coding is consistent with colour coding of charts in Figure 4.
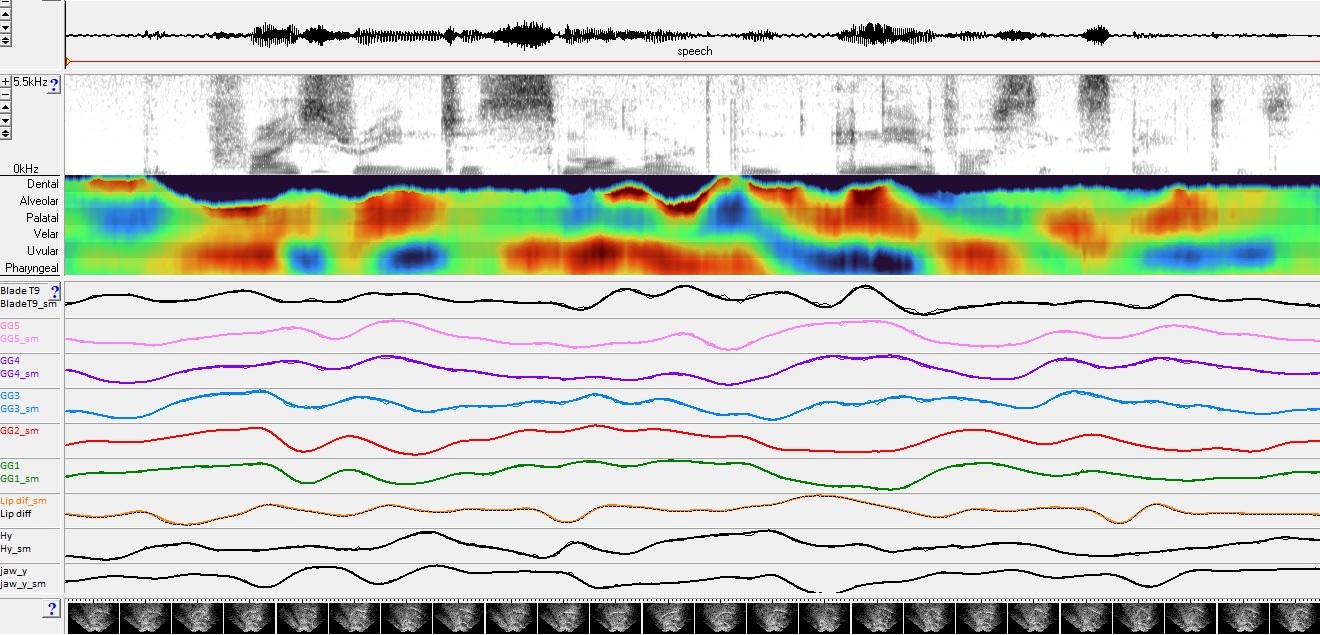
Figure 4. Sentence “The price range is smaller than any of us expected” Charts of the five genioglossus compartment doming and grooving distances from short tendon to the five colour coded points (green -lower pharynx, red-upper pharynx, blue – uvular, purple – velar, pink- palatal). The first chart is distance of short tendon to estimated keypoint 9 representing the EMA tip sesor but actually positioned on the anterior blade. The orange chart indicates distance between upper and lower EMA sensor positions ( see lip video for position of these sensors). The final two charts show distance from hyoid to mandible base and mandible base y position respectively. The bright display above the charts is a Glossogram. It displays the normalised distances from the estimated contour to the short tendon and presents a vocal tract constriction pattern comparable with the acoustic spectrogram pictured above it. The glossogram starts with dental constriction for the [th] then shifts to dual palato-alveolat constriction coupled with pharyngeo-uvular constriction, typical of a retroflex [r]. The glossogram, like the spectrogram shows is for subjective assessment and demonstrated the dynamic lingual articulation that produces the formant transitions in the spectrogram above.
Peaks and valleys in the charts indicate the start and end of motor commands to initiate and terminate transitions.
References
- SCRIBE manual. https://www.phon.ucl.ac.uk/resource/scribe/scribe-manual.htm
- Mathis, A., Mamidanna, P., Cury, K. M., Abe, T., Murthy, V. N., Mathis, M. W., & Bethge, M. 2018. DeepLabCut: markerless pose estimation of user-defined body parts with deep learning. Nature neuroscience, 21(9), 1281-1289.
- Wrench, A., & Balch-Tomes, J. 2022. Beyond the edge: markerless pose estimation of speech articulators from ultrasound and camera images using DeepLabCut. Sensors, 22(3), 1133.
- Balch-Tomes, J., Wrench, A.A., Scobbie, J., Macmartin, C., and Turk, A. (2024). Improving ultrasound pose estimation accuracy by training on co-registered EMA data. In I. Wilson, A. Mizoguchi, J. Perkins, J. Villegas, & N. Yamane (Eds.), Ultrafest XI: Extended Abstracts (pp. 91-95). University of Aizu. DOI: 10.5281/zenodo.12578650
- Wrench AA. The Compartmental Tongue. J Speech Lang Hear Res. 2024 Oct 24;67(10S):3887-3913. doi: 10.1044/2024_JSLHR-23-00125. Epub 2024 Jul 3. PMID: 38959159.